13
Jun
2022
Bar Chart in SwiftUI with Charts Framework
Reading time: 1 min
This recipe shows how to add a Bar Chart to SwiftUI using Apple's new Charts Framework.
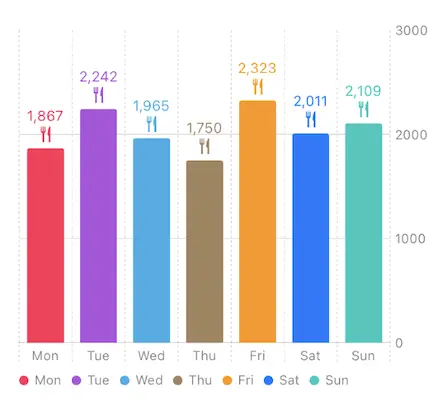
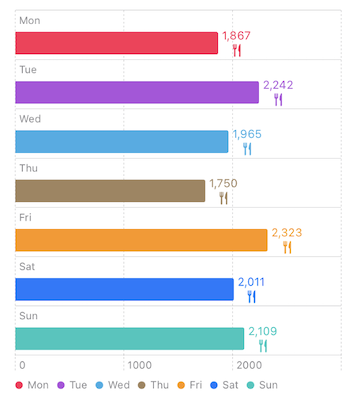
The end result looks like this:


Charts framework is available starting in SwiftUI 4 (iOS 16, macOS 12.4).
Let's start off by creating a simple structure that represents how many calories we ate each day. This is the data we'll be plotting in our bar chart:
struct FoodIntake: Hashable {
  let day: String
  let calories: Int
}

// Sample data
let intakes: [FoodIntake] = [
  FoodIntake(day: "Mon", calories: 1867),
  FoodIntake(day: "Tue", calories: 2242),
  FoodIntake(day: "Wed", calories: 1965),
  FoodIntake(day: "Thu", calories: 1750),
  FoodIntake(day: "Fri", calories: 2323),
  FoodIntake(day: "Sat", calories: 2011),
  FoodIntake(day: "Sun", calories: 2109),
]

// Colors for bar items
let markColors = [Color.pink, .purple, .cyan, .brown, .orange, .blue, .mint]
Use the Chart view to represent the chart, and add a BarMark for each food intake item:
Chart(intakes, id: \.self) { intake in
  BarMark(x: .value("Calories", intake.calories), // X axis mark and value
          y: .value("Day", intake.day)) // Y axis mark and value
    .foregroundStyle(by: .value("Day", intake.day)) // determines that "Day" represents the foreground style
    // adds annotation to the end of each bar
    .annotation(position: .trailing) {
      VStack(spacing: 0) {
        Text("\(intake.calories.formatted())")
        Image(systemName: "fork.knife")
      }
      .font(.caption)
      .foregroundStyle(markColors[intakes.firstIndex(of: intake) ?? -1])
    }
}
// colors each bar and automatically adds legend
.chartForegroundStyleScale(domain: intakes.map { $0.day },
                           range: markColors)
.frame(height: 400)
.padding()
If you want to plot a "vertical" bar chart, simply flip the X and Y values on the bar marks. Don't forged to update the annotation position to top as well:
Chart(intakes, id: \.self) { intake in
  BarMark(x: .value("Day", intake.day),
          y: .value("Calories", intake.calories))
    .foregroundStyle(by: .value("Day", intake.day))
    .annotation(position: .top) {
      VStack(spacing: 0) {
        Text("\(intake.calories.formatted())")
        Image(systemName: "fork.knife")
      }
      .font(.caption)
      .foregroundStyle(markColors[intakes.firstIndex(of: intake) ?? -1])
    }
}