Reading time: 4 min
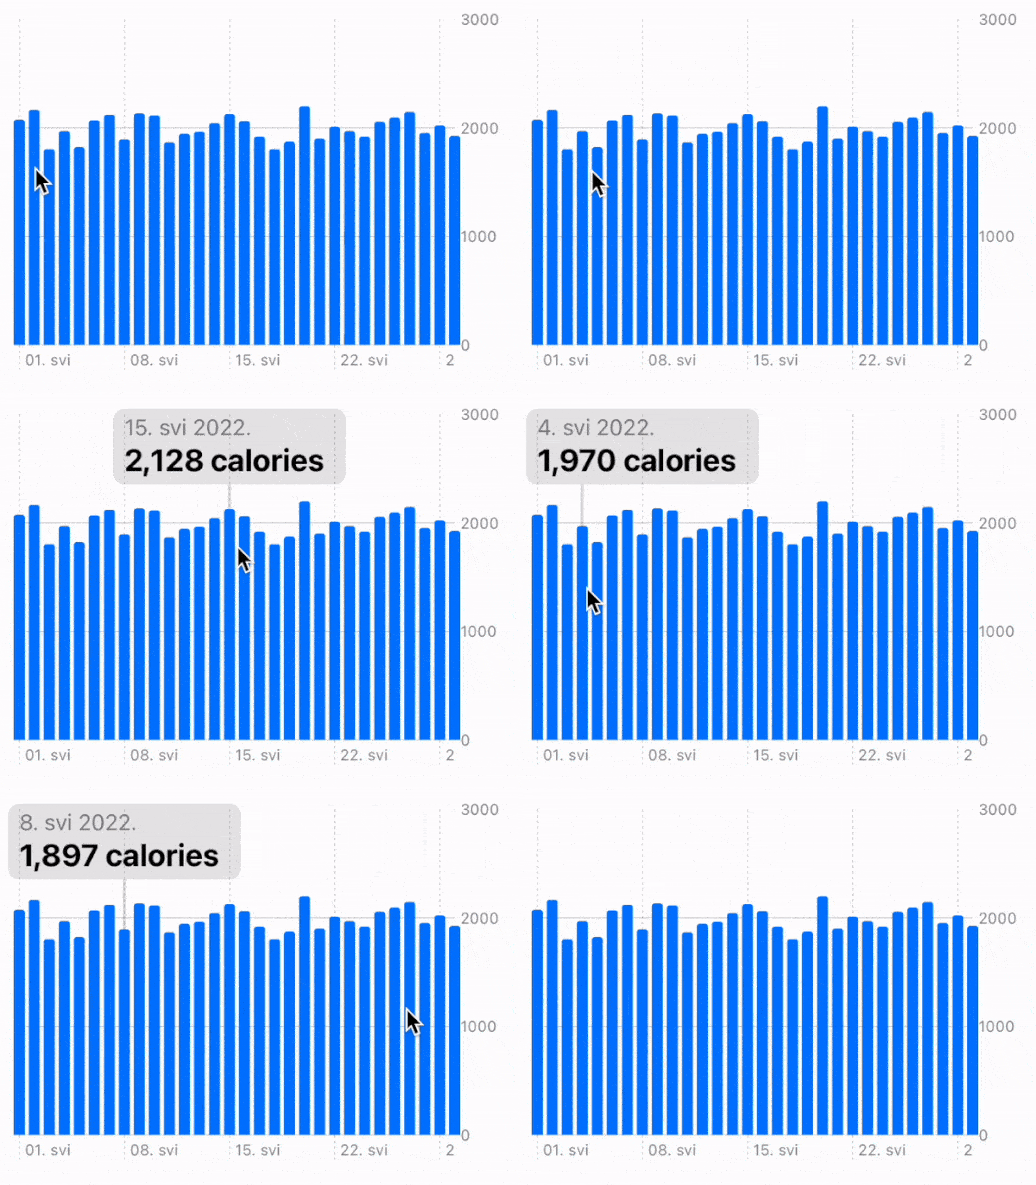
This recipe shows how to add a Scan Line / Lollipop to a Chart to SwiftUI using Apple's new Charts Framework. It allows you to read data from the chart depending on its position using tap and drag gestures.
The end result looks like this:

Charts framework is available starting in SwiftUI 4 (iOS 16, macOS 12.4).
TL;DR You can find the full code in this gist.
Sample data & bar chart
Let's start off by creating a simple structure that represents how many calories we ate each day. This is the data we'll be plotting in a bar chart. We'll also create a month's worth of random sample data:
struct FoodIntake: Hashable {
  let date: Date
  let calories: Int
}

// Utility function to easily create dates
func date(year: Int, month: Int, day: Int) -> Date {
  Calendar.current.date(from: DateComponents(year: year, month: month, day: day)) ?? Date()
}

// Sample data
let intake = stride(from: 1, to: 31, by: 1).map { day in
  FoodIntake(date: date(year: 2022, month: 5, day: day),
             calories: Int.random(in: 1800...2200))
}
Then, let's plot that data using a bar chart:
struct ScanLineTest {
  var body: some View {
    Chart {
      ForEach(intake, id: \.self) { data in
        BarMark(x: .value("Date", data.date),
                y: .value("Calories", data.calories))
      }
    }
  }
}
Reading selected data
The next step is to detect user taps and drags on the chart and map their positions to sample data. We can do this using the chartOverlay modifier, which exposes a ChartProxy instance. ChartProxy can access the plot area of the chart, allowing us to access data values via X and Y coordinates of our gesture positions.
First, add a @State property to track selected intake:
@State var selectedElement: FoodIntake?

var body: some View {
// ... same as before ...
Then, add the chartOverlay modifier to your chart:
Chart {
  // .. same as before ...
}
.chartOverlay { proxy in
  GeometryReader { geo in
    Rectangle()
      .fill(.clear)
      .contentShape(Rectangle())
      .gesture(
        SpatialTapGesture()
          .onEnded { value in
            let element = findElement(location: value.location,
                                      proxy: proxy,
                                      geometry: geo)
            if selectedElement?.date == element?.date {
              // If tapping the same element, clear the selection.
              selectedElement = nil
            } else {
              selectedElement = element
            }
          }
          .exclusively(before: DragGesture()
            .onChanged { value in
              selectedElement = findElement(location: value.location,
                                            proxy: proxy,
                                            geometry: geo)
            })
      )
  }
}
The findElement method looks like this:
func findElement(location: CGPoint,
                 proxy: ChartProxy,
                 geometry: GeometryProxy) -> FoodIntake? {
  // Figure out the X position by offseting gesture location with chart frame
  let relativeXPosition = location.x - geometry[proxy.plotAreaFrame].origin.x
  // Use value(atX:) to find plotted value for the given X axis position.
  // Since FoodIntake chart plots `date` on the X axis, we'll get a Date back.
  if let date = proxy.value(atX: relativeXPosition) as Date? {
    // Find the closest date element.
    var minDistance: TimeInterval = .infinity
    var index: Int? = nil
    for dataIndex in intake.indices {
      let nthDataDistance = intake[dataIndex].date.distance(to: date)
      if abs(nthDataDistance) < minDistance {
        minDistance = abs(nthDataDistance)
        index = dataIndex
      }
    }
    if let index {
      return intake[index]
    }
  }
  return nil
}
Drawing scan line overlay
The last step is to actually draw the scan line and the selected value indicator (which are, combined, known as a lollipop). This action is essentially reverse from the previous step - here, we need to map selected data to chart position. Again, we can use ChartProxy for this, as its position(forX:) method does exactly what we want. Also, the chartBackground modifier exposes a ChartProxy and allows us to place views behind the chart, so that they don't interfere with chart gestures:
Chart {
  // ... same as before ...
}
.chartOverlay { proxy in
  // ... same as before ...
}
.chartBackground { proxy in
  ZStack(alignment: .topLeading) {
    GeometryReader { geo in
      if let selectedElement {
        // Find date span for the selected interval
        let dateInterval = Calendar.current.dateInterval(of: .day, for: selectedElement.date)!
        // Map date to chart X position
        let startPositionX = proxy.position(forX: dateInterval.start) ?? 0
        // Offset the chart X position by chart frame
        let midStartPositionX = startPositionX + geo[proxy.plotAreaFrame].origin.x
        let lineHeight = geo[proxy.plotAreaFrame].maxY
        let boxWidth: CGFloat = 150
        let boxOffset = max(0, min(geo.size.width - boxWidth, midStartPositionX - boxWidth / 2))

        // Draw the scan line
        Rectangle()
          .fill(.quaternary)
          .frame(width: 2, height: lineHeight)
          .position(x: midStartPositionX, y: lineHeight / 2)

        // Draw the data info box
        VStack(alignment: .leading) {
          Text("\(selectedElement.date, format: .dateTime.year().month().day())")
            .font(.callout)
            .foregroundStyle(.secondary)
          Text("\(selectedElement.calories, format: .number) calories")
            .font(.title2.bold())
            .foregroundColor(.primary)
        }
        .frame(width: boxWidth, alignment: .leading)
        .background { // some styling
          ZStack {
            RoundedRectangle(cornerRadius: 8)
              .fill(.background)
            RoundedRectangle(cornerRadius: 8)
              .fill(.quaternary.opacity(0.7))
          }
          .padding([.leading, .trailing], -8)
          .padding([.top, .bottom], -4)
        }
        .offset(x: boxOffset)
      }
    }
  }
}
.frame(height: 250)
.padding()
And that's it! You can now easily scan your chart and display selected data. Note that this method works regardless of chart type, i.e it can be used with scatter plot chart as well!